menu

By Gary Warner

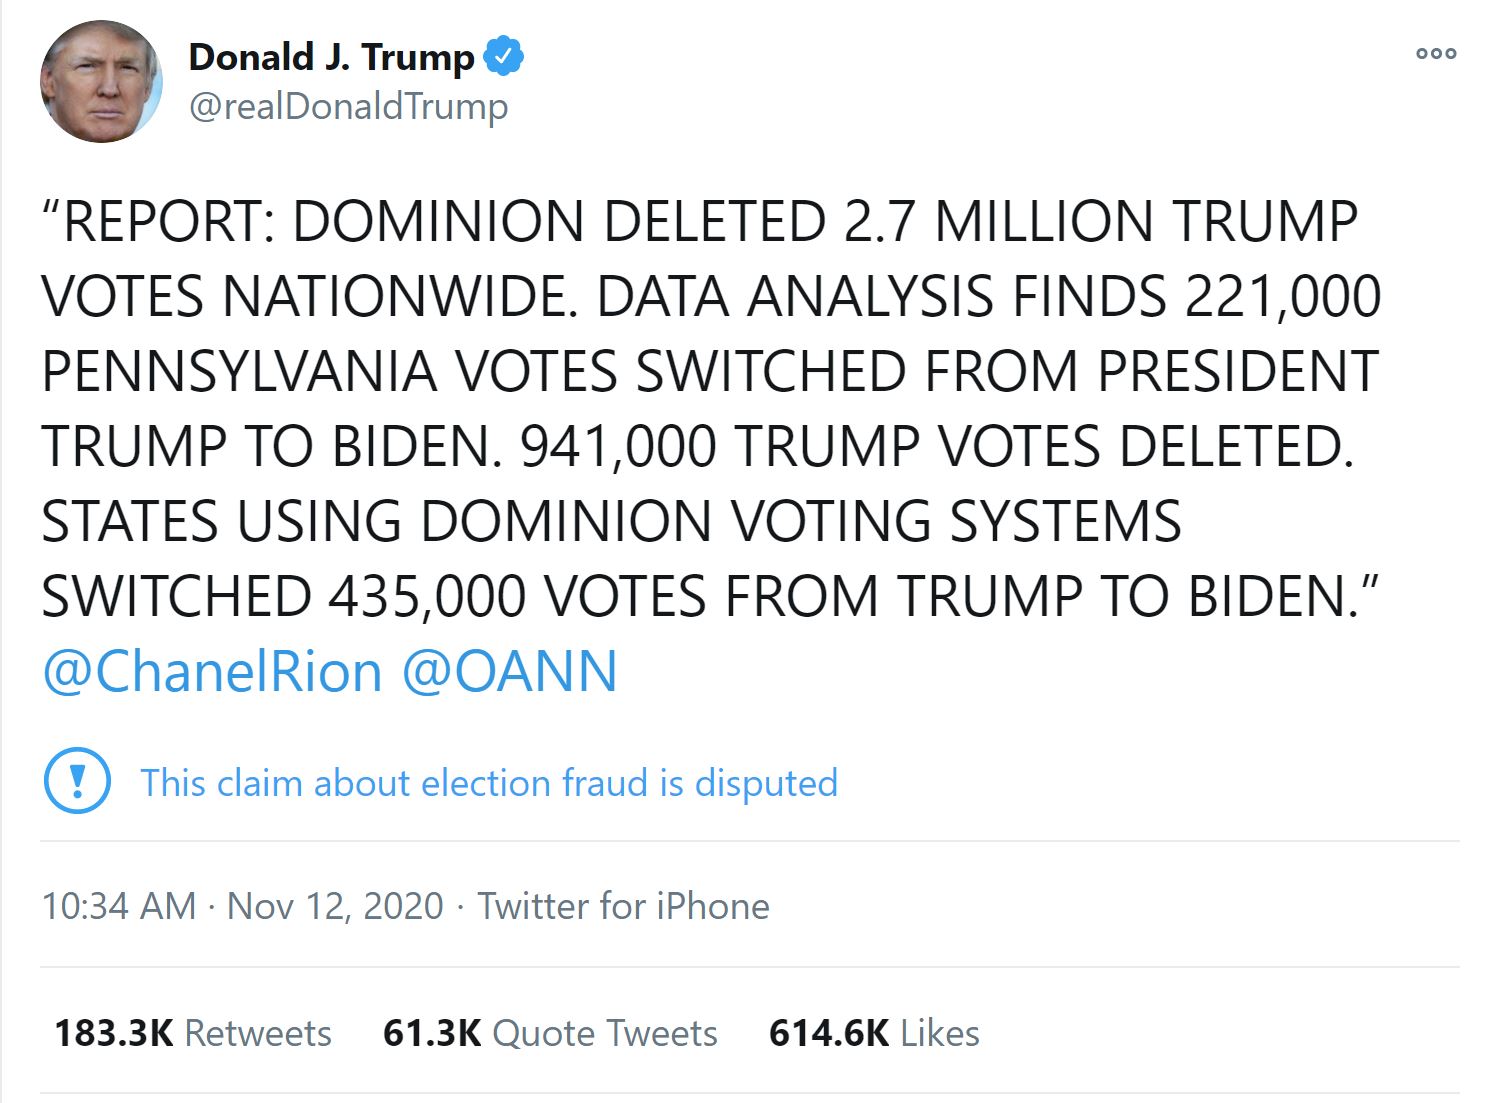
Conspiracy theorists and Trump’s most extreme #MAGA supporters are claiming to have proof that votes were changed from Trump to Biden while other votes were discarded. When President Trump tweeted that 2.7 million Trump votes had been deleted nationwide, he was retweeted more than 180,000 times and his tweet was liked more than 600,000 times.

TrumpTweet

We can contrast this joint statement of the Election Infrastructure Government Coordinating Council Executive Committee, shared by the DHS Cybersecurity & Infrastructure Security Agency, the government agency assigned to look out for election fraud: “There is no evidence that any voting system deleted or lost votes, changed votes, or was in any way compromised.”

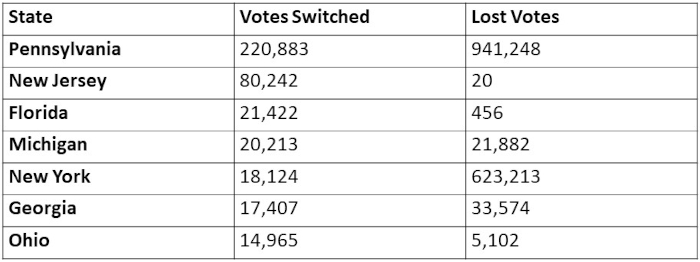
So where do the numbers mentioned by President Trump come from and why are they not evidence of widespread fraud? The source of these numbers is a set of tables being shared by Q-Anon types that have figures such as these:

GWarner post_vote total example

The numbers seem far too precise to be entirely made up. Analysts in the UAB Computer Forensics Research Lab who specialize in disinformation campaigns helped me dig in to find the source of the numbers. The analyst behind these numbers is a member of the website “thedonald[.]win” who goes by the user name “PedeInspector.”

PedeInspector

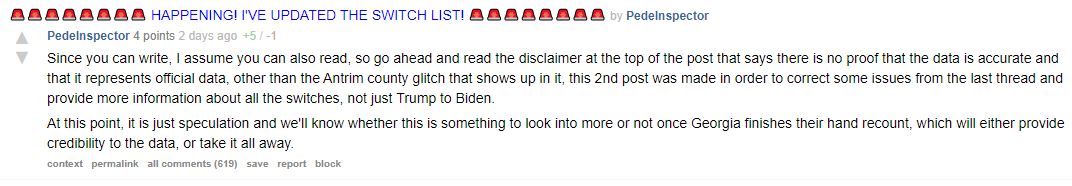
In his thread, labeled “Happening!”, he explains his methodology for calculating the vote switch and lost vote numbers, which have been widely shared, including by President Trump himself. His “proof” that his methodology is correct is that his data shows publicly acknowledged “glitches” such as the Antrim county, Michigan “glitch” which was later confirmed to be human error.

To allow others to confirm his work, PedeInspector has posted a copy of all of the vote count data that he used for his analysis, along with his Python program, on the website “workupload[.]com.”

Here’s an example of the data analysis

  • {“trumpd”:0.578,”bidenj”:0.401},”votes”:573857,”timestamp”:”2020-11-04T01:51:26Z”}
  • {“trumpd”:0.568,”bidenj”:0.406},”votes”:574417,”timestamp”:”2020-11-04T01:51:52Z”}

In these records, at a certain timestamp, there were 573,857 votes that had been counted in Michigan, with Trump receiving 57.8% of the votes and Biden receiving 40.1% of the votes, which would work out to 331,689 votes for Trump and 230,116 votes for Biden.

Twenty-six seconds later, there were 574,417 counted votes, which means 560 votes were counted during that 26 seconds. But now, Trump is listed as receiving 56.8% of the vote and Biden receiving 40.6% of the vote. That would mean Trump now had 326,268 votes (5,421 LESS votes) and Biden now had 233,213 votes (3,097 MORE votes). If we assume that all 560 new votes went to Biden, that would mean that Biden has 2,537 more votes than he should, or so it would seem.

PedeInspector’s interpretation of these numbers is then that Biden “stole” 2,537 votes from Trump and that 2,884 votes were “lost.”

The methodology used by PedeInspector was to extract each timestamped data record for each state from his source, which expressed the current state of the vote using numbers such as these in the format listed above, and at every timestamp, calculate the number of assigned votes for Biden and the number of assigned votes for Trump, and when Trump’s “next timestamp” votes were less than the “previous timestamp” votes, calculate how many votes were “switched” or “lost.”

Our first assessment was to see whether it was possible that PedeInspector had altered the data after acquiring it from the original source. He has not. We downloaded PedeInspector’s files and also acquired the data from his source and compared each timestamped record to see if there were any discrepancies. With the exception that some data has been ADDED (in the form of newer timestamped records) to the original source files since being downloaded, no discrepancies were found. For example, with the Michigan votes files, the PedeInspector copy of the file has 534 timestamped vote_shares records, ending with 2020-11-09T23:04:46Z. The New York Times copy of the file has 538 timestamped vote_shares records, ending with 2020-11-12T22:03:58Z.

What? The New York Times?

Yes, the data used by PedeInspector was downloaded from the Times. The URL provided by PedeInspector as his sources are URLs such as this example, as well as this example.

Each state has a similar file there, just replace “Michigan” or “Pennsylvania” with the name of the state whose data you wish to review. We assume this data will be quickly made unavailable, but surprisingly, it is still live days after being disclosed as the source by PedeInspector.

However, despite being the source of the data file, The New York Times is not the source of the data. The full format of each record includes an additional field, “eevp_source”: “edison”. On their “Election Polling Page,” Edison boasts that they provide vote tabulation for ABC News, CBS News, CNN and NBC News. Edison’s executive vice president, Rob Farbman, has already spoken to the accuracy of their numbers when debunking the “HAMMER” conspiracy theory, pointing out that a change in the Armstrong County, Pennsylvania votes was “simple human error.” But conspiracy theorists want to believe and have tried to use their own data analysis of Edison numbers to show that there were not a handful of changes, but instead thousands of changes.

Rounding Errors and Math is Hard

Several other members of “thedonald[.]win” website have pointed out issues with PedeInspector’s analysis. The greatest problem is that the data files being used for PedeInspector’s analysis were intended to be ingested to shade a state on a map and not to do vote-by-vote analysis. To help me make sense of the numbers, and the competing versions of the analysis programs, I was pleasantly surprised to have five student programmers in my lab who jumped on an early Saturday morning Discord call to help me out.

As one of my programmers explained the issue:

“You know how dividing 4 by 3, you get 1.33333333… and it goes on forever? Is 1.333 the same number as 1.33333 repeating? They’re similar, but in cutting the number off, you lose precision. 1.333 is not 1.333333 repeating. For most purposes, this is fine. When you need a number to be exactly right, such as when handling money or a vote count, it’s dangerous to lose precision. These small losses in precision can add up over time, making significant differences in the final result.”

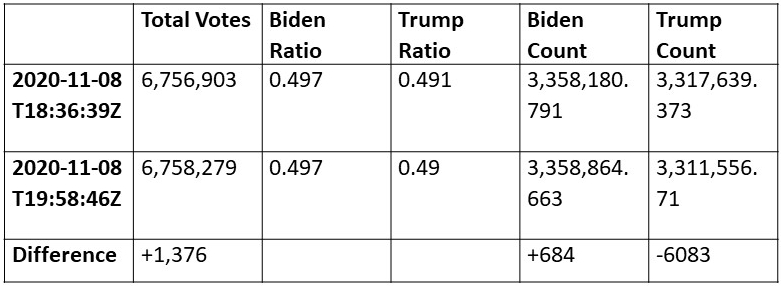
Here’s an example from the Pennsylvania data. At timestamp 2020-11-08T18:36:39Z, there had been 6,756,903 votes counted. In the next reporting period, 2020-11-08T19:58:46Z, there had been 6,758,279 votes counted. President Trump is said to have 49.1% of the first number and 49.0% of the second number.

The granularity of the Edison data being used by both PedeInspector and VisualScience only has accuracy to 1/10 of one percent. It was never intended to be used in this way! In the table below, the change in Trump count is easily accounted for by the percentage being flipped from 49.1% to 49.0%, which is likely the result of rounding.

GWarner post_vote table2

Both the original PedeInspector Python program and the new VisualScience Python program show their bias in their code. PedeInspector calls his program “fraudcatch” and ONLY searches for examples where the candidates lose votes. VisualScience calls his main routine “newFindFraud” and again only searches for places where votes are lost. It is in the nature of rounding numbers that sometimes the number will round down and sometimes the number will round up.

PedeInspector selected only the lines of data where President Trump “rounded down” and then added all of these numbers together, claiming that 900,000 votes had “disappeared.” His dramatic findings are being thrown around all over the Internet, but his own retractions are hardly mentioned. PedeInspector has repeatedly tried to point out that he does not know the accuracy of the data, did not have permission to use the data, and that he has made corrections to his analysis that are being ignored.

PedeRetraction

PedeRetraction2

Another amateur researcher at TheDonald pointed out that the raw data, in integer form, for every precinct is also available on The New York Times website, but it is much more difficult to find, as the file names include timestamps to the 1/1000ths of seconds, such as this file, which is an example precinct-by-precinct, county-by-county, integer votes cast in Pennsylvania file. For each “state-level” summary data entry, there is solid precinct level data that could be used to prove that in the vast majority of instances, rounding—rather than neglect, error or deceit—was the cause of the data. To locate this file, the analyst wrote a program that tested for the presence of file names by checking to see if there was a file whose name ended in “.000Z.json” then “.001Z.json” then “.002Z.json” – basically “rolling the numbers” until he found the actual raw data for a single instance of the Pennsylvania vote reporting.

To finalize this election and silence disinformation based on this data, it is urgent that Edison Research and/or The New York Times help explain the seeming discrepancies found by “PedeInspector” so that we can end the speculation and welcome and support the Biden Transition Team. This is the last “hanging chad” of the 2020 election, and it desperately needed to be addressed. We hope that in our comments here we have provided enough guidance for that process to be finalized and for the public to realize that the most dramatic claim of voter fraud is not supported by the numbers and is even doubted by its originator.

Gary Warner is the Director of Research in Computer Forensics at the University of Alabama at Birmingham (UAB). 

  • quirkasaurus

    To make it accurate, the shown percentages would have to exceed the significant digits of the total votes. If the percentages had been expressed as: 0.4910716528112612, THEN the PedeInspector algorithm for the rolling calculated votes will work correctly.

    • Gary Warner

      Or, if they had looked at the actual vote count instead of an approximation they stole from the New York Times website and used for a purpose which was never intended.

      • trot

        Fascinating analysis Gary, thanks! It’s all a little beyond me. Is it possible to create a program that mirrors the original program so that the inaccuracies of rounding “prove” that biden was losing votes? If so, could you and your team accomplish that?

        • Victor

          He would have known that from day 1 but it never happened.

      • DomesticTerrorist

        It was taken from Edison data…
        Edison is the primary aggregator of election data for all the media outlets. It provides one set of data per election…
        The media outlets all get the same data.

  • Phantom Piper

    I agree that the sigfig issue is a problem — in my own analysis of the same data set the fluctuations in vote count that came from back-calculating from percentages set of red flags (literally!), which were easily dealt with as rounding errors. That doesn’t explain the glaring issue of the 941 thousand votes that were reported and then un-reported (which I found in my independent analysis of this database).

    I have reached out to Edison (and sent them a link to this page, and they DENY being the source of the data: “Edison Research created no such report and we are not aware of any voter fraud.”

    I have looked at the votes for Michigan, Georgia, Pennsylvania, and Wisconsin and find some more anomalies (that cannot be explained by rounding errors, requiring that we look further for an explanation.

    Georgia:
    Between 6:06 am on Nov 4 and 6:12 am, the total number of votes reported DECREASED by 28,966 (with Biden actually losing more votes than Trump).
    Between 2:16 am on Nov 5 and 2:50 am, the total number of votes reported DECREASED by 3242
    Between 2:50 am on Nov 5 and 2:54 am, the total number of votes reported DECREASED by another 1366 votes

    The Georgia Senate race had some minor irregularities: with 3223 votes disappearing about 6:30 PM on Nov. 5

    Michigan:
    Between 1:51:26 am on Nov 4 and 1:51:52 am, the total number of votes reported for Trump DECREASED by about 5,400 (while Biden picked up about 3100).
    Between 5:53pm on Nov 4 and 6:23PM, the total number of votes reported DECREASED by 12,437.
    Between 5:46pm on Nov 6 and 6:11PM, the total number of votes reported DECREASED by 2796.
    Between 5:40pm on Nov 9 and 9:42PM, the total number of votes reported DECREASED by 6649.

    Pennsylvania is far more suspicious:
    Between 2:13 am and 2:14 am on Nov 4, 239,804 votes disappeared.
    Between 2:16 am and 2:17 am on Nov 4, another 114,886 votes disappeared.
    Between 2:21 am and 2:22 am on Nov 4, yet another 586,189 votes disappeared.
    This is about 941 THOUSAND votes gone missing in Pennsylvania on Nov 4 from what had been reported earlier.

    Another 280 votes went away the morning of Nov. 6.

    Maybe these anomalies are innocent, but they really need to be explained.

    A similar story (but not as bad) in Wisconsin
    3343 votes gone missing at 5:24am on Nov. 4
    Minor decreases in votes on 9 different occasions on Nov 12 , and three times again on Nov 16. (Were all of these changes due to a recount? If so, that is quite suspicious as well, because the final tally, after 12 instances of numbers contracting (and subsequently expanding) between Nov 12 and Nov 16 was that the total vote count increased by “1” — such a precise recount is unheard of (especially given the imprecision in the process))

    I am certainly not going to conclude from these data that there is “fraud,” but, to a former auditor like me, these anomalies raise red flags that need to be addressed, and conspiracy theories will abound until they can be put to rest.

  • J. Jones

    Your article did not explain the discrepancies. Your hypothesis is that the decimal will round off thousands of votes in either a up or down direction. Yet There Is Not A Single Occurence of This Net Gain For Trump. Statistically impossible? Your students methodology only confirmed the “conspiracy”. BY converting ACTUAL votes into a fraction percentile, then rounding off decimals before converting back to approximated actual votes you can steal large quantities of anything.
    Office Space is a hilarious Movie! They programmed the database to take pennies off of millions of transactions and they had tens of thousands of dollars over night.

    • Gary Warner

      You are missing the point, J.Jones. No one but the Conspiracy theorists counted the votes this way. I’ve gone over their code. It only looks for places where Trump (and in later versions, either candidate) “lost votes” – but the numbers upon which they base their theory are not claimed to be the “vote count” by anyone!

      • John Paluska

        Of course it looks for areas where Trump lost votes. . . because it was rampant and happened repeatedly, as his program found.

        Think about your argument for a second, Mr. Warner. You are saying that a program designed to find lost Trump votes that FOUND lost Trump votes, is not doing its job of finding lost Trump votes because it only searched for lost Trump votes.

        Well, if we’re being reasonable, it shouldn’t have found any lost Trump votes at all if there were no lost Trump votes, right?

        So the fact of the matter is, the program actually FOUND votes that were lost from President Trump. If there was nothing to find, it wouldn’t have found anything.

        • Itsnonsense

          Wrong, Mr. Warner! You forget that Biden and Trump never equal an entire 100%. The trick is they use the other candidates to flip flop between 1.2% and 1.3%. One way deducts from them, the other way deducts from Trump. And look who benefits from both in their percentages? This pattern continues on through the end AND is the same for other swing states. It’s intentional fraud. In my opinion Edison and AP are responsible for how they are pulling data from the database while the software is responsible for not storing the votes as integers. Many at fault here, including Biden. Truth will prevail. https://uploads.disquscdn.com/images/74a8c12bbdf642daf32c780f8abb989ac8eae36a3303d2ff21754f9871655c7d.png

      • Itsnonsense

        Wrong, Mr. Warner! You forget that Biden and Trump never equal an entire 100%. The trick is they use the other candidates to flip flop between 1.2% and 1.3%. One way deducts from them, the other way deducts from Trump. And look who benefits from both in their percentages? This pattern continues on through the end AND is the same for other swing states. It’s intentional fraud. In my opinion Edison and AP are responsible for how they are pulling data from the database while the software is responsible for not storing the votes as integers. Many at fault here, including Biden. Truth will prevail. https://uploads.disquscdn.com/images/74a8c12bbdf642daf32c780f8abb989ac8eae36a3303d2ff21754f9871655c7d.png

      • Blues of Morderer

        Can you stop calling people conspiracy theorists? People have the right to question and verify things. You are acting like a bully.

        • artman99

          Lol

        • Haynes Horne

          Yes, this university man has written a hit piece, from the first paragraph to the last, evaluating the argument before even begining to look at the data. I’m sure he calls himself a data scientist, but he is none. Moreover, he has not the slightest scintilla of interest in truth, only in shutting down a theory. Some scientist, huh? We need to look more closely at this fellow for connections with Dominion and Secretaries of State’s, and his tax-funded gig in Birmingham, where vote fraud determined the movement of Jefferson County’s original capital from the farming town of Elyton, where people labored, to the real estate haven in Birmingham, where people speculated. Don’t tell Gary. He will call it another conspiracy theory.

      • DomesticTerrorist

        You also missed his point that the lost numbers should have been seen for both candidates…
        No good arithmetic explanation exists for this…regardless of the accuracy. Also, Edison numbers are reported back to them by individuals who manually transfer/refer them on from the locations they are counted at.
        I at one time did this task for State elections in AL…
        It is a simple, manual process.

      • winone

        That is false. The numbers in Edison Research are used by a number of major news outlets including NY Times and they all get the same data.

  • Gary Warner

    https://uploads.disquscdn.com/images/bc30c3707200fd4ef2e3d1eeb55ff2738f22600d89c9bcd3cf53abee3441d8b8.jpg

    Hopefully this graphic will help. There is a wide range of numbers that could be represented by a 0.1% rounded figure. Without looking at the underlying numbers, it is impossible to say whether the underlying number is a “best case” or “worst case” situation. This diagram shows how the jump in one ‘reporting period’ has a wide range of possible values — and the truth CANNOT be known by looking at the summary data used by the Conspiracy Theorists.

    • Haynes Horne

      Once again, a scientist would never use adhominen against someone with a different view of the question. That spoils the framework of argumentation, making his own argument look weaker. How impactuful: he even capitalizes Conspiricy Theorists! The CIA memo, however, did not capitalize the phrase when they introduced it to Newweek in the 1960s.

    • Rick

      I’ve been scouring the Internet for two years trying to find someone who can explain the vote switching, and your explanation is the closest I’ve seen. I follow your argument for a possible 0.1% rounding discrepancy, but how do you explain a 0.6% switch? In the Pennsylvania JSON file, just navigate to data > races > 0 > timeseries > 187. I provided the screenshots here. There is no “rounding error” that can account for this large of a switch. https://uploads.disquscdn.com/images/896667d89018eec71e19d4105ebcdb9369d93b2f239d2beb4a8d42c71b94a441.jpg

      • Meat Fighter

        Rick,

        I’m not a data analyst, however I am involved in the election integrity movement. One aspect that has been missed in this discussion of “vote switching” is the non-organic presence of time stamped batch updates for each candidate matching the running total of each candidate to a hundredth of a decimal. In Florida for example this occurs in roughly 40% of the batch updates. this occurs whether the total batch vote is 1,000 votes or 20,000 votes. This is mathematically impossible. From the data analyst teams that I work, they have said to me this is can only be present with some type of aggregation controlling algorithm.

        For example, pull the Florida 2020 JSON data, convert it to excel for a readable format, and look at how the batch updates consistently match the running total percentages to a hundredth of a decimal. This occurred in more than 25 states in 2020. And this data exactly mirrors the SCYTL election night reporting data sets. This is not organic and I have yet to get an explanation.

  • Deb Michaels

    I’m joining the discussion awfully late, but, wanted to take a shot and ask: if the data analysis isn’t truly finding lost votes or deleted votes, why would we see vote totals on live TV go down? In just my cursory search, there are 6 or 7 examples in videos and now screen shots where you can see votes go down from one scroll update to the next update. It seems Edison and news organizations got the same deleted vote results because they were broadcast live right before our eyes. Weren’t they using the data as intended? If so, how can, essentially, the same results be proof that the data wasn’t used as intended?

  • Joseph W. Singley

    Can you provide a link to the PedeInspector retractions statements?

    • artman99

      He posted them in the article

  • BobH_SLO

    Were the underlying datasets ever made available to the public? If so, how can they be obtained?

  • winone

    Gary wants people to believe that the numbers we see are not real and no one is using those numbers so that we can welcome a guy that no one in their right mind would elect to the head of anything let alone a position in government leadership. Why should we believe that? Because Gary says so. Forget your lying eyes and believe Gary.